Statistical Analysis in BE Studies: How to Calculate Power and Sample Size Correctly

When a generic drug company wants to bring a new version of a popular medication to market, they don’t need to repeat the full clinical trials of the original brand. Instead, they run a bioequivalence (BE) study-a tightly controlled trial that proves their version delivers the same amount of drug into the bloodstream at the same rate as the brand-name product. But here’s the catch: if the statistical analysis is flawed, the whole study fails. And one of the most common reasons for failure? Wrong sample size.
It’s not just about having enough people. It’s about having the right number. Too few, and you might miss a real difference-even if the drug works perfectly. Too many, and you waste money, time, and expose more people to testing than necessary. Regulatory agencies like the FDA and EMA don’t just recommend power and sample size calculations-they require them. And they’ll reject your application if they’re not done right.
Why Power and Sample Size Matter in BE Studies
Unlike regular drug trials that ask, “Is this drug better?” BE studies ask, “Is this drug the same?” That’s a harder question to prove statistically. You’re not trying to show a difference-you’re trying to show similarity within strict limits. The acceptable range for bioequivalence is usually 80% to 125% for the ratio of test to reference drug exposure (measured by AUC and Cmax). If the 90% confidence interval of that ratio falls entirely inside those bounds, the drugs are considered equivalent.
But how do you know you’ll actually detect equivalence if it’s there? That’s where statistical power comes in. Power is the probability that your study will correctly conclude bioequivalence when it truly exists. The standard target is 80% or 90%. That means if you ran this same study 100 times under identical conditions, you’d get a successful result 80 or 90 times.
Why not aim for 100%? Because that would require massive sample sizes-sometimes over 200 people. It’s not practical. Regulators accept 80% as the minimum, but for drugs with narrow therapeutic windows (like warfarin or lithium), they often expect 90%. The FDA’s 2021 review of generic drug submissions found that 22% of rejections were due to inadequate power or sample size calculations. That’s not a small number. It’s a major bottleneck in bringing affordable generics to patients.
What Drives Sample Size in BE Studies?
Sample size isn’t pulled out of thin air. It’s calculated using four key inputs:
- Within-subject coefficient of variation (CV%)-This measures how much a person’s drug levels fluctuate from one dosing period to another. For most drugs, CV% ranges from 10% to 35%. But for highly variable drugs (like certain antiepileptics or blood thinners), it can jump to 40% or higher.
- Expected geometric mean ratio (GMR)-This is your best guess of how the test drug compares to the reference. Most generic manufacturers assume a GMR of 0.95 to 1.05. If you assume 1.00 (perfect match) but the real ratio is 0.93, your sample size calculation will be too low by 30% or more.
- Equivalence margins-Standard is 80-125%. But for some drugs, especially in Europe, regulators allow wider margins (like 75-133%) for Cmax, which can cut sample size by 15-20%.
- Study design-Most BE studies use crossover designs (each participant gets both drugs), which are more efficient than parallel designs (two separate groups). Crossover designs reduce variability and typically need half the subjects.
Here’s a real-world example: For a drug with a 20% CV and a GMR of 0.95, you’d need about 26 subjects to achieve 80% power. But if the CV jumps to 30%, you suddenly need 52 subjects. That’s double the cost, double the time, double the ethical burden. That’s why pilot studies matter.
Pilot Data Is Non-Negotiable
Many teams try to save time by using published CV values from literature. Bad idea. The FDA analyzed 147 BE submissions and found that literature-based CVs underestimated true variability by 5-8 percentage points in 63% of cases. That’s not a small error-it’s a study-killing miscalculation.
Dr. Laszlo Endrenyi, a leading expert in clinical pharmacology, found that 37% of BE study failures in oncology generics between 2015 and 2020 were due to overly optimistic CV estimates. The fix? Run a small pilot study with 8-12 subjects. It costs $10K-$20K, but it prevents a $2M failure down the line.
And don’t just look at one parameter. You have to calculate power for both AUC and Cmax. The American Statistical Association’s 2022 survey showed only 45% of sponsors check joint power-the chance that both parameters pass simultaneously. If you only power for AUC and Cmax turns out to be more variable, your overall success rate drops by 5-10%.
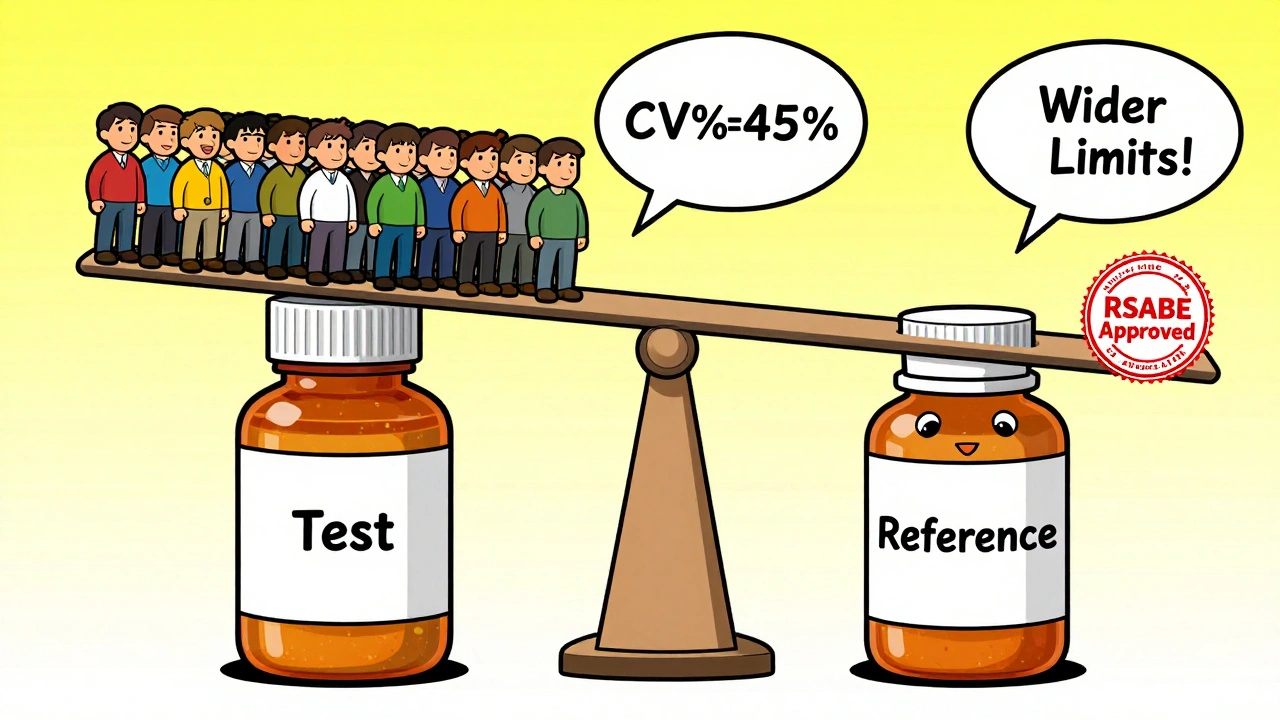
Highly Variable Drugs: The RSABE Exception
Some drugs are naturally all over the place in the bloodstream. Think of drugs like clopidogrel or cyclosporine. For these, the standard 80-125% range doesn’t work. If you tried to use it, you’d need 100+ subjects just to get a shot at success.
That’s where reference-scaled average bioequivalence (RSABE) comes in. It’s a regulatory loophole-intentionally built into FDA and EMA guidelines-that lets you widen the equivalence margins based on how variable the reference drug is. If the CV is above 30%, you can scale the limits. For example, with a 45% CV, the limits might stretch to 69-145%. This cuts sample size from 120 to 30-40 subjects.
But RSABE isn’t automatic. You need to prove the drug is highly variable. You need to justify the method. And you need to use the correct statistical model. The FDA’s 2022 Bioequivalence Review Template says 18% of statistical deficiencies come from improper use of RSABE. It’s not a shortcut-it’s a more complex path that requires expert input.
Dropouts, Sequences, and Hidden Pitfalls
Even if your sample size calculation is perfect, things can still go wrong. People drop out. They get sick. They miss doses. That’s why you add 10-15% to your calculated number. If you need 26 subjects, plan for 30. If you need 52, plan for 60.
Another hidden trap: sequence effects. In crossover studies, the order matters. If everyone gets the test drug first, then the reference, any carryover effect or learning effect can skew results. That’s why you need proper washout periods and randomization. The EMA rejected 29% of BE studies in 2022 for poor sequence design.
And don’t forget software. You can’t do this in Excel. Use specialized tools like PASS, nQuery, or FARTSSIE. These programs are built with regulatory formulas baked in. A 2022 study in the Journal of Biopharmaceutical Statistics found that PASS 15 had the most accurate and transparent implementation of EMA and FDA guidelines. But here’s the catch: most non-statisticians don’t understand the inputs. That’s why collaboration with a biostatistician isn’t optional-it’s mandatory.

What Regulators Actually Look For
The FDA doesn’t just want your final number. They want your process. In their 2022 review template, they list exactly what must be documented:
- Software name and version used
- All input parameters (CV%, GMR, power, margins)
- Justification for each assumption (e.g., “CV% based on pilot study N=10”)
- Adjustment for expected dropout rate
- Method for handling multiple endpoints
If you skip any of these, your application gets flagged. In 2021, 18% of statistical deficiencies were due to incomplete documentation-not wrong math, just missing paperwork.
And now, the FDA is pushing even further. Their 2023 draft guidance introduces rules for sample size re-estimation in adaptive designs. That means you can pause the study halfway, look at the data, and adjust sample size if needed-without breaking regulatory rules. It’s a game-changer for complex drugs, but only 5% of submissions currently use it. Why? Because regulators are still wary. The rules are new, the software is limited, and the training is scarce.
What’s Next? Model-Informed Bioequivalence
The future of BE studies isn’t just bigger samples or smarter calculations-it’s smarter modeling. The FDA’s 2022 Strategic Plan promotes model-informed bioequivalence, which uses pharmacokinetic modeling to predict drug behavior with fewer subjects. Instead of measuring blood levels at 12 time points, you might use a single measurement plus a computer model to estimate AUC. Early trials show this can cut sample size by 30-50%.
But it’s not ready for prime time. Only 5% of BE studies use it in 2023. Why? Because regulators haven’t fully validated the models. There’s no standard software. And most generic companies don’t have the in-house expertise. Still, it’s coming. Companies that invest in pharmacometrics now will lead the next wave of efficient, cost-effective BE studies.
Final Checklist for BE Study Power and Sample Size
Before you submit your BE study protocol, run through this:
- Did you use pilot data-not literature-for CV%?
- Did you calculate power for both AUC and Cmax together?
- Did you assume a realistic GMR (0.95-1.05), not 1.00?
- Did you add 10-15% for dropouts?
- Did you use a validated BE-specific tool (PASS, nQuery, FARTSSIE)?
- Did you document every assumption and software version?
- For CV > 30%, did you consider RSABE?
- Did you consult a biostatistician before finalizing?
If you can answer yes to all of these, you’re not just following the rules-you’re building a study that will pass.
What happens if a BE study is underpowered?
An underpowered BE study has a high risk of a Type II error-failing to show bioequivalence even when the drugs are truly equivalent. This leads to study failure, costly delays, and the need to repeat the trial with a larger sample. The FDA reported that 22% of Complete Response Letters for generic drugs cited inadequate power or sample size as a primary deficiency. This means your drug won’t reach the market, and you’ll lose months or years of development time.
Can I use a sample size from a similar drug in the literature?
No. Literature values for within-subject variability (CV%) often underestimate true variability by 5-8 percentage points, according to FDA analysis of 147 submissions. Relying on them can lead to underpowered studies. Always base your calculation on pilot data from your own formulation. Even a small pilot study with 8-12 subjects provides far more reliable estimates than published data.
Why is 80% power the minimum, and not higher?
80% power is the regulatory minimum because it balances scientific rigor with practical feasibility. Increasing power beyond 80% requires significantly larger sample sizes-for example, raising power from 80% to 90% with a 25% CV can increase required subjects from 36 to 52. While the FDA often expects 90% power for narrow therapeutic index drugs, 80% is accepted for most products because the risk of Type II error is considered acceptable when combined with strict equivalence limits and proper study design.
What’s the difference between RSABE and traditional BE?
Traditional BE uses fixed equivalence limits of 80-125% regardless of variability. RSABE (reference-scaled average bioequivalence) adjusts those limits based on how variable the reference drug is. If the CV exceeds 30%, the limits widen-sometimes to 69-145%-which reduces the required sample size from over 100 to 24-48 subjects. RSABE is only allowed for highly variable drugs and requires regulatory approval and detailed justification.
Do I need a biostatistician to calculate sample size?
Yes. While online calculators exist, BE sample size calculations involve complex statistical models that account for log-normal distributions, crossover designs, and regulatory-specific requirements. Most generic drug sponsors who skip expert input end up with flawed calculations. The Northwestern University Applied Statistics guidance (2019) and industry surveys consistently recommend involving a biostatistician early in protocol development to avoid costly rejections.

9 Comments

Arun Kumar Raut
Really appreciate this breakdown. I've seen too many teams skip pilot studies to save time, then get slapped with a rejection letter. A $15K pilot beats a $2M failure any day. Simple math.

precious amzy
One cannot help but observe the profound epistemological crisis inherent in reducing complex pharmacokinetic phenomena to a 90% confidence interval bounded by arbitrary percentages-80% to 125%-as if bioequivalence were a mathematical theorem rather than a biological phenomenon mediated by individual variability, gut microbiota, and the silent, unquantifiable weight of human physiology.

Carina M
It is unconscionable that so many sponsors rely on literature-derived CV values. This is not merely negligence-it is a violation of scientific integrity. The FDA’s findings are not suggestions; they are indictments. If you cannot conduct a pilot study, you do not belong in bioequivalence research.

Maria Elisha
Ugh. I just skimmed this. So basically, don’t guess, do a small test first? Got it. Thanks for the 2000-word essay on common sense.

Angela R. Cartes
RSABE is the real MVP 🙌 I saw a friend’s study get rejected because they used fixed limits on a highly variable drug. They had to redo everything. Now they use RSABE and it’s smooth sailing. Also, PASS 15 is the only tool that doesn’t make you want to cry.

Andrea Beilstein
Power isn't just a number it's a promise to the patient who needs the medicine and to the scientist who spent years getting here. We calculate sample sizes not because the FDA says so but because we owe it to the person who will swallow the pill and wonder why it works or doesn't. And if we get it wrong... well then we're not just failing a study we're failing a person

om guru
Correctly calculated power saves lives and resources. Pilot data is non-negotiable. Consult a biostatistician. Document everything. These are not recommendations they are requirements. Failure to comply is not an oversight it is professional malpractice.

Ryan Brady
Why does the FDA make us jump through these hoops while China and India just slap a label on it and ship it? We’re losing billions because some suit in Bethesda thinks 80% power is 'scientific enough'. Wake up America.

Raja Herbal
So let me get this straight… you spent 10K on a pilot study so you wouldn’t waste 2M? That’s not smart. That’s just not being an idiot. 😏
Write a comment